

USD Correlation Back Between Gold and WSFUT
: The Sept 30 year bond is Up 6 ticks and trading at 144.23.
: The Sept S&P 500 emini ES contract is 8 ticks Higher and trading at 2846.75.
: The Dec Gold contract is trading Up at 1185.12 Gold is 12 ticks Higher than its close.

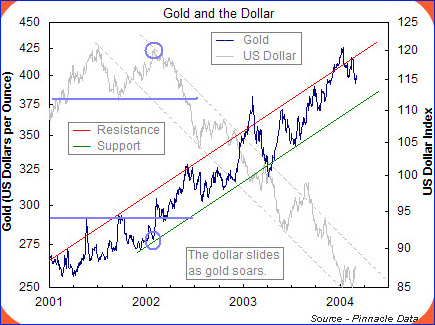
This is not a correlated market. The dollar is Down- and Crude isUp+ which is normal but the 30 year Bond is trading Higher. TheFinancials should always correlate with the US dollar such that if thedollar is lower then bonds should follow and vice-versa. The S&P isHigher and Crude is trading Higher which is not correlated. Gold istrading Up+ which is correlated with the US dollar trading Lower.Itend to believe that Gold has an inverse relationship with the US Dollaras when the US Dollar is down, Gold tends to rise in value andvice-versa. Think of it as a seesaw, when one is up the other should bedown. I point this out to you to make you aware that when we don't have acorrelated market, it means something is wrong. As traders you need tobe aware of this and proceed with your eyes wide open.

At this hour Asia is trading mainly Higher with the exception of theShanghai and Singapore exchanges which are trading Lower at this time.Currently all of Europe is trading Higher with the exception of theGerman Dax exchange which is fractionally Lower at this time.
We've elected to switch gears a bit and show correlation between the30 year bond (ZB) and The YM futures contract. The YM contract is theDJIA and the purpose is to show reverse correlation between the twoinstruments. Remember it's liken to a seesaw, when up goes up the othershould go down and vice versa.
Yesterday the ZB made it's move at around 9 AM EST. The ZB hit aHigh at around that time and the YM hit a Low. If you look at thecharts below ZB gave a signal at around 9 AM EST and the YM was movingHigher at the same time. Look at the charts below and you'll see apattern for both assets. ZB hit a High at around 9 AM and the YM wasmoving Higher at the same time. These charts represent the newestversion of MultiCharts and I've changed the timeframe to a 30 minutechart to display better. This represented a shorting opportunity on the30 year bond, as a trader you could have netted about 15 ticks percontract on this trade. Each tick is worth $31.25.
Charts Courtesy of MultiCharts built on an AMP platform
Yesterday we gave the markets an Upsidebias as the USD and the Bonds were both pointed Lower and this usuallyreflects an Upside bias. The markets didn't disappoint as the Dowgained 396 points and the other indices gained ground as well. Today wearen't dealing with a correlated market and our bias is Neutral.

Could this change? Of Course. Remember anything can happen in a volatile market. Gold Usd Correlation
So what happened yesterday to cause the markets to jump the way theydid? News that China and the United States will resume trade talkshelped to bolster the markets further and there didn't appear to be anynews related to the Turkish Tantrum. This is obviously good news as themarkets don't like to hear any talk of a trade war or proposed tradewar. It upsets the scale of things and causes disruption which theglobal markets do not want. Today we are light on the economic calendaras we have the University of Michigan numbers out at 10 AM EST andthat's pretty much it.
On Thursday, April 5th we had the honor and privilege to beinterviewed by David Lincoln on his You Tube channel. David is a floortrader for the options markets. If you listen to this interview, youwill enjoy it. To view the interview go to:

Just so you understand, Market Correlation is Market Direction. Itattempts to determine the market direction for that day and it does soby using a unique set of tools. In fact TradersLog published anarticle on this subject that can be viewed at:
http://www.traderslog.com/market-correlation-is-market-direction/
As readers are probably aware I don't trade equities. While we're onthis discussion, let's define what is meant by a good earnings report. Acompany must exceed their prior quarter's earnings per share and mustprovide excellent forward guidance. Any falloff between earning pershare or forward guidance will not bode well for the company's shares.This is one of the reasons I don't trade equities but prefer futures.There is no earnings reports with futures and we don't have to beconcerned about lawsuits, scandals, malfeasance, etc. Anytime the marketisn't correlated it's giving you a clue that something isn't right andyou should proceed with caution. Today our bias is Neutral.Could thischange? Of course. In a volatile market anything can happen. We'll haveto monitor and see.
As I write this the crude markets are Higher and the S&P istrading Higher. This is not normal. Crude and the markets are nowreverse correlated such that when the markets are rising, crude dropsand vice-versa. Yesterday September Crude dropped to a low of $64.79.It would appear at the present time that crude has support at $64.00 abarrel and resistance at $67.00. Remember that crude is the onlycommodity that is reflected immediately at the gas pump. Please notethat the front month for crude is now Sept. Last month OPEC met onceagain to cut production but the price of crude is starting to climb.Whereas prior to the production cuts the ceiling was in the 50 dollarrange, it is now in the 70 plus dollar range. The question is ifwhether this is temporary or something more permanent. As an update tothis the non-OPEC countries have come to an agreement to unilaterallycut production across the board and this has served to temporarily raisecrude prices. We'll have to see if and how long this lasts...
If trading crude today consider doing so after 10 AM EST when themarkets gives us better direction.
Crude oil is trading Higher and the S&P is Higher. This is notnormal. Crude typically makes 3 major moves (long or short) during thecourse of any trading day: around 9 AM EST, 11 AM EST and 2 PM EST whenthe crude market closes. If crude makes major moves around those timeframes, then this would suggest normal trending, if not it would suggestthat something is not quite right. As always watch and monitor yourorder flow as anything can happen in this market. This is why monitoringorder flow in today's market is crucial. We as traders are faced withnumerous challenges that we didn't have a few short years ago. HighFrequency Trading is one of them. I'm not an advocate of scalpinghowever in a market as volatile as this scalping is an alternative totrend trading. Remember that without knowledge of order flow we astraders are risking our hard earned capital and the Smart Money willhave no issue taking it from us. Regardless of whatever platform you usefor trading purposes you need to make sure it's monitoring order flow.Sceeto does an excellent job at this. To fully capitalize on thisnewsletter it is important that the reader understand how the variousmarket correlate. More on this in subsequent editions.
Nick Mastrandrea is the author of Market Tea Leaves. Market Tea Leavesis a daily newsletter that is dedicated to your trading success.Weteach and discuss market correlation. Market Tea Leaves is publisheddaily, pre-market in the United States and can be viewed at
. Interested in Market Correlation?Want to learn more?Signup andreceive Market Tea Leaves each day prior to market open.As asubscriber, youll also receive our daily Market Bias video that is onlyavailable to subscribers.
Nick Mastrandrea is the author of Market Tea Leaves. Market Tea Leaves is a free, daily newsletter that discuses and teaches market correlation. Market Tea Leaves is published daily, pre-market in the United States and can be viewed at
Nick has traded various financial instruments in his career but is currently focused on the Futures markets. At one time Nick held a NASD Series 7 license and currently holds a Life, Health and Variable Authority. He resides in the Princeton area of New Jersey and can be reached at
The information contained on InsideFutures.com is believed to be accuratebut is not guaranteed.Market data is furnished on an exchange delayedbasis by Barchart.com.Data transmission or omissions shall not be madethe basis for any claim, demand or cause for action. No information onthe site, nor any opinion expressed, constitutes a solicitation of thepurchase or sale of any futures or options contracts.InsideFutures.comis not a broker, nor does it have an affiliation with any broker.
Copyright ©2005-2018 InsideFutures.com, a Barchart.com product.All rights reserved.


0 Reviews:
Post Your Review